WinDbg – Welcome to Logging

Performing dump analysis is often times challenging due to the nature of the beast, the UI or the lack thereof :). Some commands are extremely time consuming or like me, just hate scrolling. Also there is only so much that you can view by scrolling.

Logging can be enabled before running commands that produce tons of output. We can also create seperate log files for each command by setting up separate log files before executing each command. From here, we can open the log files in an External Editor like Notepad++ and work with WinDbg on another monitor.

To enable Logging, goto the Edit Menu -> Open/Close Log File…

01

provide the Log file name and click ok. You are all done. Check the Append checkbox to append to an existing file or else the file gets overwritten.

02

After I am done capturing the logs that I need, I come back and Close Open Log File button to close the open file. This disables logging, while I take the file offline for Analysis.

The output can also be copied to excel and formatted to quickly sift though.

.foreach WinDbg

Recursively executing a command in WinDbg is one of the coolest features. In the example below, I used one method table from the output of a !FinalizeQueue command. The FinalizeQueue similar to DumpHeap provides the Method Table, Object Count, Size allocated and the Type.

  • Here 6dcf1230 is one of the Method Tables that I was interested in. I wanted to see if any objects in this table were rooted.
  • myvar is a variable that holds the output of the !DumpHeap command. –short returns only the address. Maybe in another article I will cover how to process the tokens
  • the .echo command needs no introduction, in this content it is used twice to display the address and to separate the output.
.foreach (myvar {!DumpHeap /d -mt 6dcf1230 -short}) {.echo myvar;!gcroot -all myvar;.echo **************;}


ServiceNow – Print/Export a Complex Visual Task Board

ServiceNow has a cool feature called Visual Task Board. It’s an implementation of a Kanban Board and you can read about it here. This makes life so much easier and the Team can pretty much manage the standup / 1:1 meetings. I have such board setup with 7 lanes and several 100 cards. End of the month, I wanted to save the contents of the board to a PDF for posterity. This is where it became a little complicated. The OOTB print function produces an output that wasn’t presentable.

The steps outlined in this document may change with ServiceNow’s implementation in a future release, but you get the idea.

What you need

  • Internet Explorer and it’s Developer Toolbar
  • SnagIt
  • Dual Monitor (for a large Dashboard)
  1. Open Internet Explorer and Navigate to your VTB. Expand it over as many monitors as you need so that you see all the content horizontally. We will work on a fix to get the vertical content in step 2.
  2. Open F12 Developer Tools from the Tools menu or Press F12. Follow these 2 steps to edit the body tag and adjust the height of the div tag as shown below.

01.png

02.png

3. We now have a window that shows all of the content. Capture the window using SnagIt or any other tool that supports scrolling at this point and capture the page. I then saved it png / pdf formats.

Hope this helps till ServiceNow implements a feature to export this Dashboard in its entirety.

Fun with WinDbg

I was looking into a Memory LeakĀ  using a win-32 w3wp memory dump. Looking into the FinalizeQueue, I saw System.Data.DataTableCollection object in Gen2. Based on the hunch, I dumped the method table.

01

Dumped a couple of addresses listed above

02

I looked at the dataset and the _list, which brought me to the _items below.

03

The list of items is actually an Array.

04

Dumping the array and reviewing one of the array element(s) as below.

06

Viewing the value for tablename showed the string below. This is one of the objects used to retain Trace data.

07
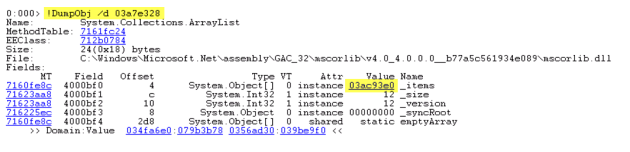
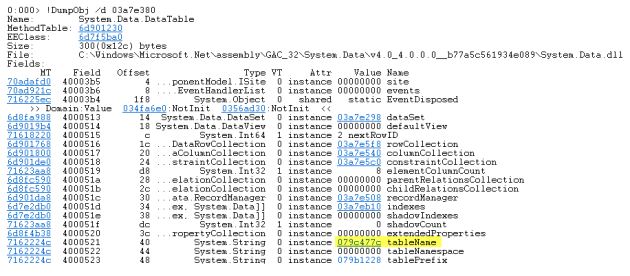
I am not posting the rest of the table structure, but if you are interested, you are welcome to follow the steps. Trace.axd was still active and ended up disabling it. Now back to looking into the actual issue.