Troubleshooting – Erratic Load Balanced Web Application behavior

Have you ever run into situations where the Customer reports an issue, but the Dev Team is not able to reproduce it. Well, I have had several of these and sometimes one of the Web Server is configured differently than the rest in a Load Balanced environment. Sometimes these behavior also exhibit when we actually deploy a new farm or add new servers to an existing farm.

Recently a customer reported that attachments on a particular customer portal were not being viewable. Sure enough, when we tested this issue initially, it worked for us. We were able to quickly able to use this technique to isolate the server and then add the missing mime type.

The actual issue/behavior can be identified using Fiddler or the Developer Tools. Identifying the server that is causing the erratic user behavior is key to either quickly resolving or removing the server from the farm for offline resolution.

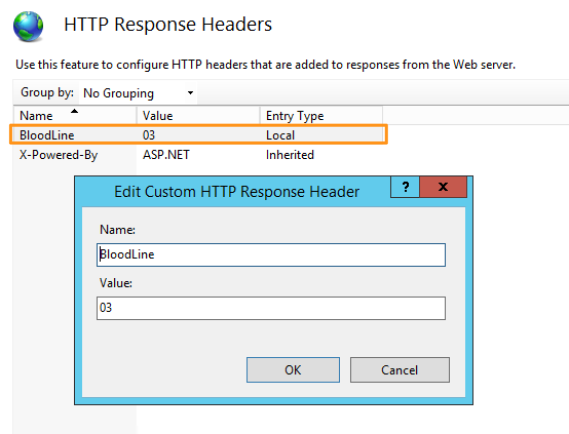
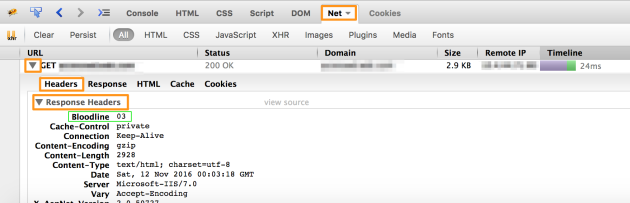
When adding each server to the farm, add a HTTP Response Header that uniquely identifies the server as shown in the screenshot below. Don’t include any sensitive details that might compromise your server.

screen_shot_2016-11-11_at_4_19_00_pm

Shown below is a Network Capture using Firefox / Firebug, but the same steps apply to Fiddler and other Developer Tools. After you have captured enough events to reproduce the issue, sift through the requests to find the offending request, identify the HTTP Response Header and you will be able to locate the server.

screen_shot_2016-11-11_at_4_03_53_pm

Keep in mind that the Developer Tools have limitation to the total number of requests / responses that can be captured without degrading performance. fiddler seems to be a better tool of choice for this particular debugging scenario.

It’s possible to programmatically set the HTTP Response Headers, but that’s a different topic.

This database does not have one or more of the support objects required to use database programming. Do you want to create them?

We have all expanded the Database Diagram node in SQL Server Management Studio and see the dialog below. Click “Yes” to accept and go straight to reverse engineer the objects. Ever wondered what goes on beyond the scenes?

11-3-2016-11-32-35-am

The required objects to build Database Diagrams are not installed by default in a new database, including the sample databases. Listed below are the objects that are created, when we accept the offer to get them created.

Table
 dbo.sysdiagrams

Procedure(s)
 dbo.sp_upgraddiagrams
 dbo.sp_helpdiagrams
 dbo.sp_helpdiagramdefinition
 dbo.sp_creatediagram
 dbo.sp_renamediagram
 dbo.sp_alterdiagram
 dbo.sp_dropdiagram

Function(s)
 dbo.fn_diagramobjects

That’s it. Now you are all set to go ahead and create the ERD

Now the interesting question is how to find these objects 🙂 If so read this article to use the Profiler.

Profiling (SQL Server 2016) – Objects

If you are new to SQL Server Profiler, it would be best to read thru best practices before profiling on a resource intensive Production System.

The steps outlined here are to use SQL Profiler and find objects that were created during a DDL event for features that are beyond your control. For example, I used this to find the objects that were created when enabling the Database Diagram feature for a newly created database.

Steps at a High Level

  • Connect to the Database
  • Setup your Filters
  • Select the Columns that we are interested in
  • Start / Stop the Trace

I started with a Blank Template.

01

Click the Events Section tab at the Top and follow the steps outlined below.

02

Check “Show all events” and “show all columns”. For this particular scenario, find the “Objects” group and select the 3 Events as shown above. Selecting just the columns that we need is little difficult, as this requires that we uncheck each checkbox. I find that right clicking on the column header and selecting “Deselect Column” little less painful. Wish the SQL Server product Team could make this selection much easier to work with. Alternatively, you can skip this step and retrieve all the columns and adjust the display later).

The final step is to add column filters. Best practice is always filter as much as possible to capture as little as possible. In this case, I am filtering based on the database that I am interested in. The checkbox, Exclude rows that do not contain values will exclude all rows will NULL values for this column.

03.png

These are the columns that I had selected. Except SPID and EventClass, you can pretty much shorten the list of Columns.

I had saved the resulting Trace to a file and the screenshot below was created after the fact. You can right click on the Trace Result Grid, select Properties and apply filters etc.

If you would like to view the actual stored procedure code, use the “TextData” column and “SQL:StmtStarting” Events. Remember to uncheck “Exclude rows that do not contain values in the Column Filter dialog above.

Screen Shot 2016-11-03 at 8.12.19 PM.png