Memory Leak – Microsoft.Reporting.WinForms.LocalReport
May 13, 2017 1 Comment
Several weeks ago I was asked to assist with a sluggish ASP.NET C# MVC application. This application is an OLTP system and processes several thousand orders a day. It was hosted on a Windows 2012 R2 64bit 16 Core machine. After discussing with the developer, I was told that the application has acceptable levels of performance for a while and then becomes sluggish (this behavior suggests some kind of a leak). At times, it becomes extremely slow and rebooting the machine solves the problem. The problem exhibits itself more frequently during days when there were above average volumes.
Downloading Process Explorer from SysInternals, I found the w3wp.exe (there were several, but 2 of them stood out). Process Explorer does not display handle information by default. I will probably blog about this separately. There are many articles out there that explain how to look for Handles using Process Explorer. This should get you started. Here is another excellent blog explaining the theoretical limit of handles. It’s a theoretical limit because there are many types of thresholds that an application can reach which causes severe performance degradation.
I knew that we had a potential handle leak. There were also other issues within the application, that were not related to the handle leak. The challenge was to isolate the handle leak versus defects in the program logic, 3rd party hardware behaviors (like non genuine printer cartridges) and various other user errors. Debugging a live system with several 100 users connected wasn’t happening. We were able to get a 4.5Gb memory dump.
When I moved the memory dump to a machine where I could analyze it, I found that the Production server was running an older version of the .NET Framework. The MS Symbol server wasn’t much help. I ended up copying the complete framework64 folder to the local machine (a different folder, not the Microsoft.NET\Framework folder) and loaded SOS using the .load command.

Using the time command, the overall CPU utilization by the Process compared to the System uptime showed that it wasn’t CPU contention.

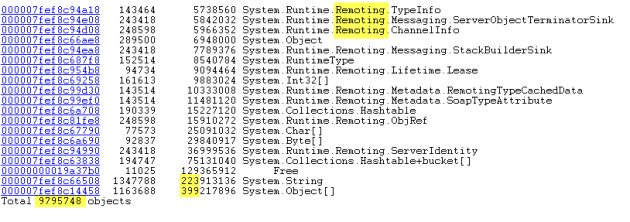
The dumpheap command displays the managed heap. The output contains the Method Table, Object Instance Count, Memory Allocated and the Type from left to right. !dumpheap -stat reported about 164k lines of output and 9.7M object references. Many of these objects pointed to dynamically created Report Expressions.
Typically the next logical step is to use !dumpheap -mt <<method table address>> to display all the individual object instances and then reviewing the individual objects to understand them better.

Looking for loaded modules using the !eeheap -loader command showed that the worker process had 2622 App Domains (with a heapsize of 537mb). Dumping one of the modules using !DumpModule command pointed to a Dynamically loaded Expression Library associated with SQL Server Reporting Services.
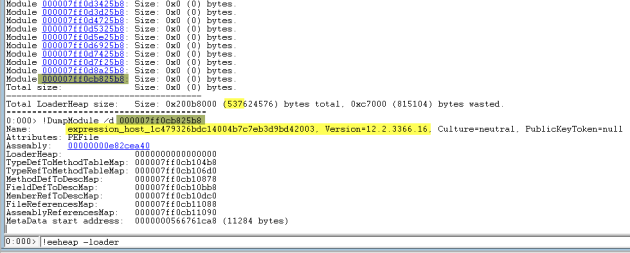

At this point, I knew that the issue may be related to the Dynamically Loaded Expression Assembly and its associated AppDomain that failed to unload. What was keeping the AppDomain from unloading? The dynamic expression library is used by the LocalReport object, which is part of the Microsoft.Reporting.Winforms namespace.
Further research showed that creating a new AppDomain is per design. The developers @ Microsoft had identified an issue with the dynamic expression library being loaded into the Default AppDomain and using up more memory each time the LocalReport object was created. An assembly once loaded into an AppDomain can never be unloaded. Hence the dynamic assembly was loaded in a new AppDomain and if all goes well, the AppDomain can be safely unloaded. As per the documentation calling LocalReport.ReleaseSandBoxAppDomain should unload the AppDomain. Unfortunately, the unload never happens because there is a problem with the internal implementation of the Dispose Method.
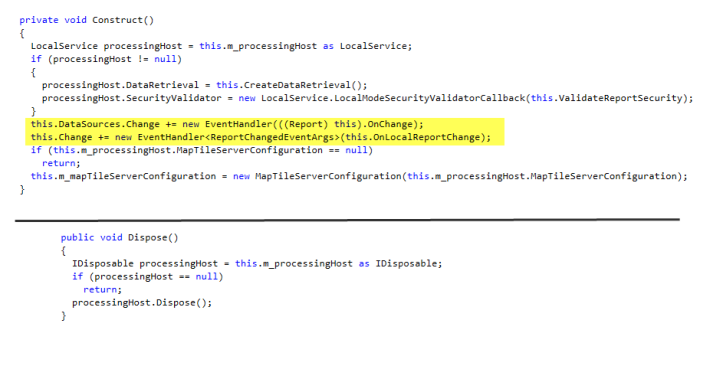
Using .NET Memory Profiler (JetBrains dotPeek), I was able to identify the Event Delegate

Looking at the implementation, the handlers are not removed in the Dispose method. This in turn keeps the AppDomain from unloading. Hope this gets resolved in a future release. For now, we are recycling the Application Pool more frequently to work around the memory leak and the developers are looking at an alternate solution to print the labels.
One of the questions that I was asked while presenting my findings with the project manager, is why did this suddenly become a problem, since the application had been in Production for over 2 years. The issue had been there from the very beginning. The OOTB Application Pool Recycle was causing the host process to shutdown after a period of inactivity (this app was used only between 8am-5pm). So it had enough time to shutdown after hours and the problem would never surface until the transaction volume increased, at which point the application started hitting thresholds.
It always helps to set baselines. Keep tabs on System configuration, Transaction Volume and major system change events. This will greatly shorten the time it takes to troubleshoot performance issues.
